Intro
Welcome to my portfolio. I’m a data analyst with a strong background in computer science, focused on transforming raw data into clear, actionable insights. Check out my awesome work.
I enjoy working with data to uncover hidden patterns, identify trends, and provide solutions that support informed decision-making.
Using tools like Excel, Power BI, SQL, Python, AWS and data visualization techniques, I turn complex datasets into simple, meaningful stories.
I am passionate about solving real-world problems with data and continuously improving my skills to deliver accurate and impactful results.
Projects
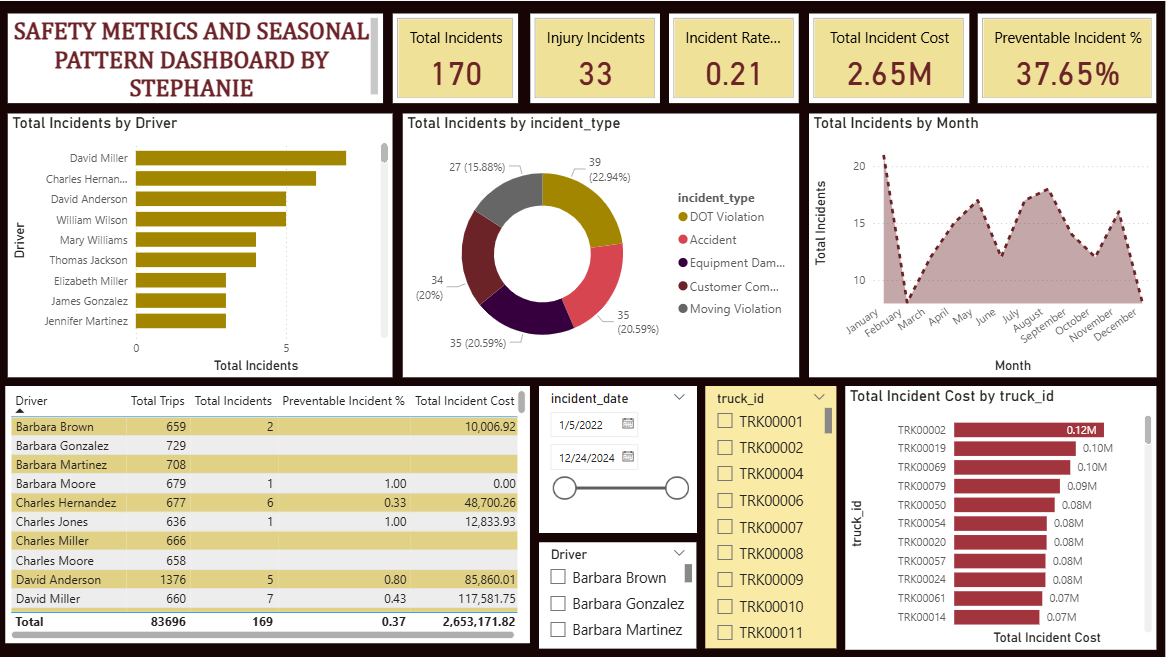
Logistics Operations Analysis Dashboard | Power BI & Data Analytics
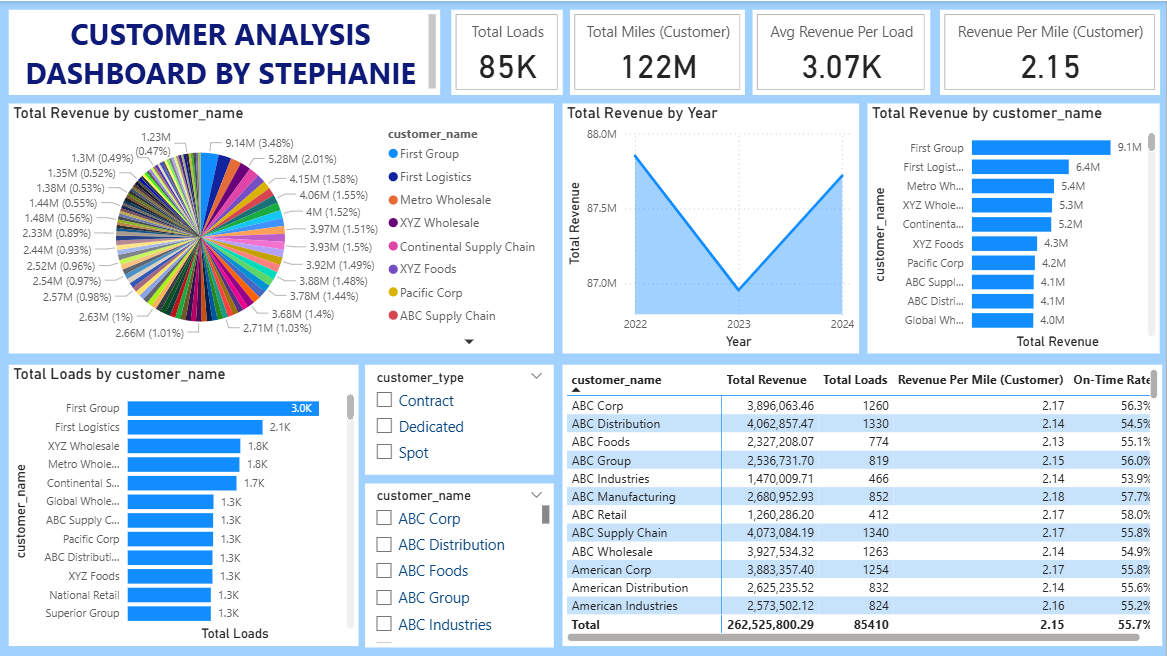
Developed a comprehensive Logistics Operations Analysis solution using Power BI to evaluate transportation performance, fleet operations, customer activity, fuel efficiency, maintenance costs, and delivery performance across a logistics network.
The project involved designing a relational data model integrating multiple operational datasets including trips, loads, customers, drivers, trucks, fuel purchases, maintenance records, and safety incidents. Built interactive dashboards and KPIs to analyze operational efficiency, profitability, utilization trends, and service performance.
Key Highlights:
Designed end-to-end logistics data model with multiple fact and dimension tables
Performed data cleaning, transformation, and relationship modeling
Built dynamic KPIs using DAX measures
Analyzed route profitability, fleet utilization, and fuel consumption trends
Developed customer revenue and service-level analysis
Created driver performance and safety monitoring dashboards
Visualized maintenance costs and downtime impact on operations
Delivered interactive reports to support business decision-making
Tools & Technologies:
Power BI
Excel
DAX
SQL
Data Modeling
Data Cleaning & Transformation
Business Intelligence & Dashboard Design
Sales Performance Analysis Dashboard | Power BI & Data Analytics
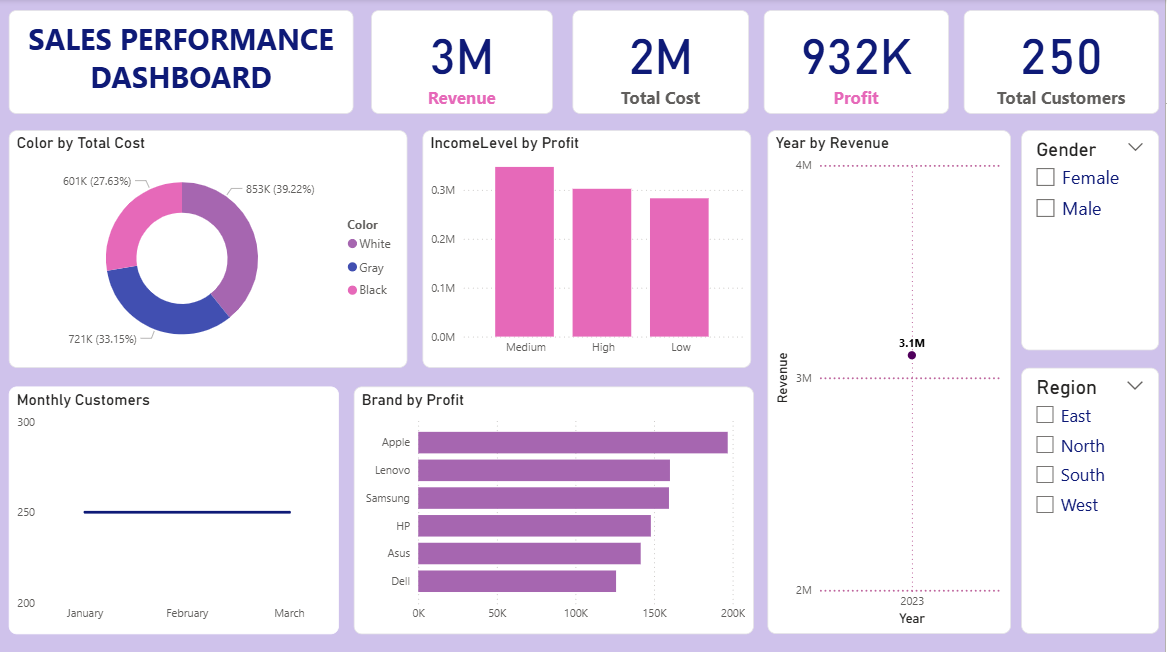
Developed a comprehensive Sales Performance Analysis Dashboard using Power BI to evaluate business sales performance, customer trends, profitability, product performance, and regional sales insights across multiple business segments.
The project involved designing an interactive business intelligence solution that integrates sales-related datasets to monitor revenue generation, total costs, customer distribution, brand profitability, and demographic purchasing patterns. Built dynamic dashboards and KPIs to support strategic business decision-making and performance tracking.
Key Highlights:
Designed an interactive sales analytics dashboard for business performance monitoring
Performed data cleaning, transformation, and modeling for accurate analysis
Built dynamic KPIs using DAX measures for Revenue, Profit, Cost, and Customers
Analyzed customer purchasing behavior across different income levels
Developed brand profitability analysis to identify top-performing products
Visualized monthly customer trends and revenue growth patterns
Created demographic and regional sales filtering for deeper business insights
Designed interactive reports and slicers for enhanced data exploration
Delivered actionable insights to support sales optimization and profitability improvement
Tools & Technologies:
Power BI
Excel
DAX
Data Modeling
Data Cleaning & Transformation
Business Intelligence & Dashboard Design
Sales Analysis Dashboard | Microsoft Excel & Data Analytics
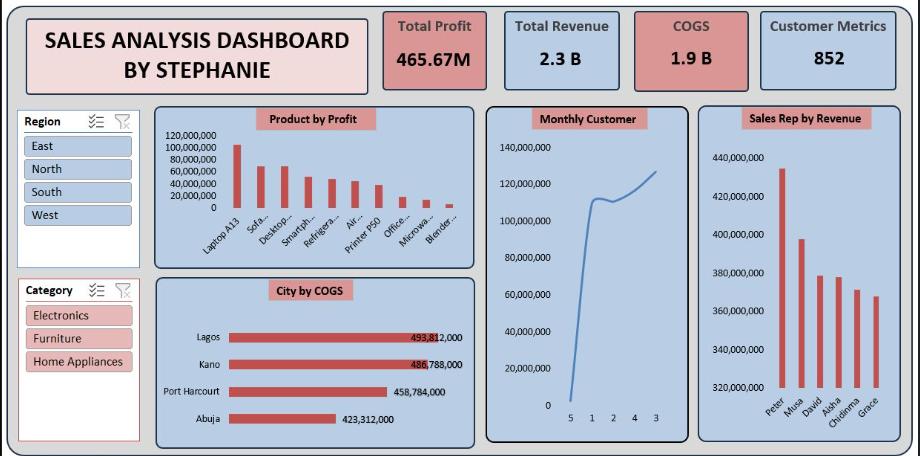
Developed a comprehensive Sales Analysis Dashboard using Microsoft Excel to evaluate product profitability, regional performance, city-level cost of goods sold (COGS), monthly customer trends, and sales representative revenue across a multi-region retail business operating in Nigeria.
The project involved designing an interactive Excel dashboard integrating multiple sales datasets across regions (East, North, South, West), product categories (Electronics, Furniture, Home Appliances), and key cities including Lagos, Kano, Port Harcourt, and Abuja. Built dynamic charts
and KPI summary cards to analyze revenue performance, profit margins, customer growth, and individual sales rep contribution..
Key Highlights:
Designed an end-to-end sales data model consolidating product, region, city, and customer datasets
Performed data cleaning, transformation, and structured data organization in Excel
Built dynamic KPI summary cards tracking Total Profit (₦465.67M), Total Revenue (₦2.3B), COGS (₦1.9B), and Customer Metrics (852)
Analyzed product-level profitability across 10+ SKUs including Laptop A13, Smartphones, Refrigerators, and Home Appliances
Developed city-level COGS breakdown revealing Lagos as the highest cost centre at ₦493.8M
Visualized monthly customer acquisition trends showing significant growth trajectory
Created sales representative revenue comparison identifying top performers such as Peter and Mosa
Integrated region and category slicers for dynamic, interactive filtering across all visuals
Tools & Technologies:
Microsoft Excel
Pivot Tables & Pivot Charts
Excel Slicers & Interactivity
Data Cleaning & Transformation
KPI Dashboard Design
Data Visualization & Business Reporting
About

I am a data analyst with a background in computer science, passionate about exploring data to uncover insights that support better decision-making. I enjoy working with data because it allows me to solve real problems, discover patterns, and turn complex information into something clear and useful.
My journey in data analysis has helped me build strong skills in tools such as Excel, Power BI, SQL, python, AWS and data visualization techniques. I use these tools to clean, analyze, and present data in a way that is easy to understand and actionable.
I also enjoy working on projects that challenge me to think critically and improve my problem-solving abilities.
I am detail-oriented, curious, and always eager to learn new methods and technologies in the data field. My goal is to continue growing as a data analyst and contribute to projects where data can be used to drive meaningful impact.
Outside of data, I enjoy learning new tech skills and improving my knowledge in computer science and analytics.
Feel free to connect with me on LinkedIn
Contact
Elements
Text
This is bold and this is strong. This is italic and this is emphasized.
This is superscript text and this is subscript text.
This is underlined and this is code: for (;;) { ... }. Finally, this is a link.
Heading Level 2
Heading Level 3
Heading Level 4
Heading Level 5
Heading Level 6
Blockquote
Fringilla nisl. Donec accumsan interdum nisi, quis tincidunt felis sagittis eget tempus euismod. Vestibulum ante ipsum primis in faucibus vestibulum. Blandit adipiscing eu felis iaculis volutpat ac adipiscing accumsan faucibus. Vestibulum ante ipsum primis in faucibus lorem ipsum dolor sit amet nullam adipiscing eu felis.
Preformatted
i = 0;

while (!deck.isInOrder()) {
    print 'Iteration ' + i;
    deck.shuffle();
    i++;
}

print 'It took ' + i + ' iterations to sort the deck.';
Lists
Unordered
- Dolor pulvinar etiam.
- Sagittis adipiscing.
- Felis enim feugiat.
Alternate
- Dolor pulvinar etiam.
- Sagittis adipiscing.
- Felis enim feugiat.
Ordered
- Dolor pulvinar etiam.
- Etiam vel felis viverra.
- Felis enim feugiat.
- Dolor pulvinar etiam.
- Etiam vel felis lorem.
- Felis enim et feugiat.
Icons
Actions
Table
Default
| Name |
Description |
Price |
| Item One |
Ante turpis integer aliquet porttitor. |
29.99 |
| Item Two |
Vis ac commodo adipiscing arcu aliquet. |
19.99 |
| Item Three |
Morbi faucibus arcu accumsan lorem. |
29.99 |
| Item Four |
Vitae integer tempus condimentum. |
19.99 |
| Item Five |
Ante turpis integer aliquet porttitor. |
29.99 |
|
100.00 |
Alternate
| Name |
Description |
Price |
| Item One |
Ante turpis integer aliquet porttitor. |
29.99 |
| Item Two |
Vis ac commodo adipiscing arcu aliquet. |
19.99 |
| Item Three |
Morbi faucibus arcu accumsan lorem. |
29.99 |
| Item Four |
Vitae integer tempus condimentum. |
19.99 |
| Item Five |
Ante turpis integer aliquet porttitor. |
29.99 |
|
100.00 |